Numbers, done right.
Free finance & statistics calculators + practical guides. 0 login; ∞ calculations run locally in your browser.
32 free tools Runs entirely in your browser No sign-up
Studios
Four studios. One standard.
Full-featured tools for stock valuation, advanced analytics, crypto markets, and small area estimation. All four run in your browser.

Stock Valuation Studio
Forecast cash flows, discount them to today, and compare intrinsic value with the market price. A built-in AI assistant explains each assumption as you go.

Analysis Studio
Weight survey data to population targets, run the analysis on screen, and publish Word and Excel reports. Free to use; a $299 annual license covers the advanced features.

Crypto Studio
Value, signals, and risk for crypto.
Available soon

SAE Studio
Produce reliable estimates for counties, towns, and districts where survey samples run thin, using model-based small area estimation.
How is Maine feeling?
A short monthly survey on the economy, costs, health care, and politics in Maine. Fourteen questions, about two minutes. Results publish live on the public dashboard.
Maine residents are weighing in now. Fourteen questions, about two minutes.
How Maine Mood works
Answer 14 questions
Fourteen questions on the economy, the state, and the people running it. Two minutes, anonymous, no sign-up.
How would you rate economic conditions in Maine today?
See live results
Results update as responses come in. Every chart shows the full sample, weighted to match Maine.
Illustrative preview. Live results are on the dashboard.
Compare month to month
Monthly waves stack up over time, so you can watch Maine's mood move instead of guessing from one poll.
Illustrative preview. Monthly waves stack up over time.
Everything you need to get the numbers right
Free statistical calculators, practical finance guides, and Excel templates with working formulas. One site, four sections, no sign-up.
Finance
Statistics for investors: position sizing, backtests, and reading earnings beyond the headlines.
Explore finance →Tools
Thirty-two free tools that run in your browser, including sample size, A/B tests, power, Kelly sizing, options payoffs, and DCF valuation.
Open the tools →Blog
Three posts a week starting November 9, 2026: statistics for investors, valuation, survey methods, and Maine data, plus the free template downloads.
Read the blog →Shop
Premium products: the statistics textbook for investors, delivered via Gumroad, and the automated stock valuation suite for Google Sheets, $19.99 on Gumroad.
Visit the shop →Popular Tools
Swipe for more tools →
Latest guides
Why backtests lie
Overfitting and the multiple-comparisons problem: why the strategy that aced its backtest usually fails live, and the checks that expose curve fitting.
The earnings beat is mostly noise
Why quarterly earnings surprises barely move long-run returns, and the two questions that separate signal from noise in any earnings headline.
Position sizing without blowing up
Expected value, base rates, and the Kelly fraction: a disciplined framework for deciding how much to risk on any idea, before the idea gets exciting.
Daily 7
Seven stocks to watch today, updated every weekday morning: why they are moving, catalysts, risks, and options angles.
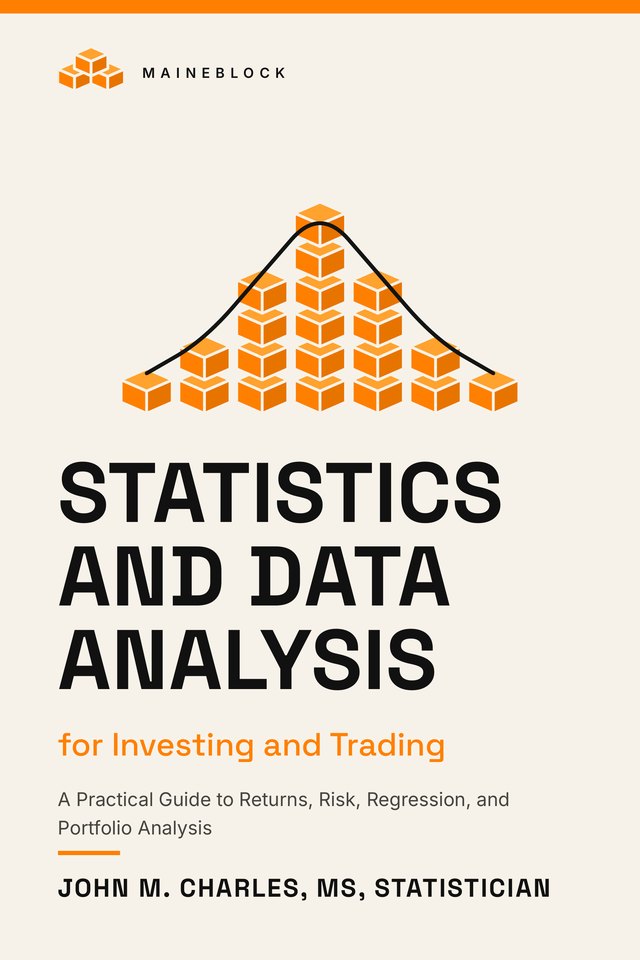
Statistics and Data Analysis for Investing and Trading
Returns, risk, regression, valuation, and portfolio math for investors, by John M. Charles, MS. Fifteen chapters, with worked examples and an R lab at the end of every chapter, SPSS syntax wherever the method has an SPSS form, and an Excel workbook in Chapters 4, 9, 10, and 15.
The Investor Stats Cheat Sheet
A free three-page PDF: breakeven win rates, stop-loss sizing, volatility drag, reverse valuation, and how to tell a real track record from noise. Plus new tools as they ship.
Free forever. Unsubscribe anytime.