Statistics and Data Analysis for Investing and Trading
A Practical Guide to Returns, Risk, Regression, and Portfolio Analysis
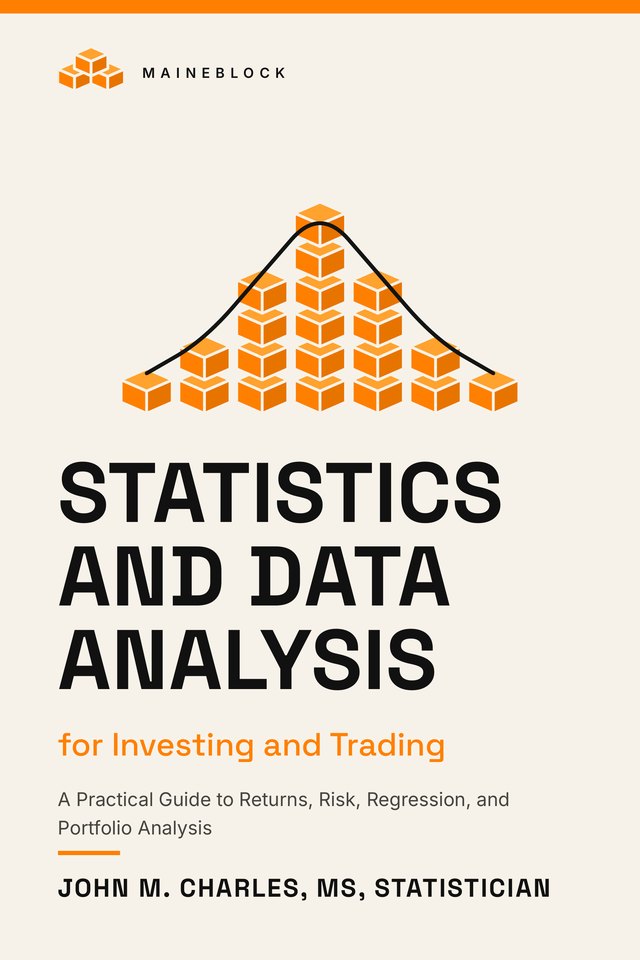
The statistics behind sound investing and trading decisions, worked through on real market data and checked step by step.
Fifteen chapters in five parts, 368 pages. Nine datasets built from public sources carry the examples. Every chapter closes with an R lab, with SPSS syntax wherever the method has an SPSS form, and an Excel workbook in Chapters 4, 9, 10, and 15. Three appendices gather the formula reference, worked answers to all 155 concept questions in the book, and a glossary of 229 terms.
Formats and prices
- Digital edition (PDF): $24.99 on Gumroad. The full text of the print edition, with the same figures and tables. The PDF reads on any computer, tablet, or e-reader that opens PDF files.
- Kindle edition: $19.99, live on Amazon.
- Paperback: $24.99, live on Amazon.
Secure checkout and delivery handled by Gumroad.
What the reader learns
- Returns and risk, computed step by step: volatility, drawdowns, volatility drag, and risk-adjusted performance.
- How wrong a number could be: sampling, confidence intervals, and how many observations a claim rests on.
- Regression and beta: what they measure, and what they do not prove.
- Valuation from the statements up: discounted cash flow, multiples, and the growth rate already priced into a stock.
- Claims tested before they are trusted: significance, event studies, base rates, and backtests that do not lie to you.
- Portfolio math: correlation, real diversification, and position sizing, with the Kelly criterion in practical form.
Chapters
- Chapter 1: The Investor’s Statistical Toolkit
- Chapter 2: Describing Returns
- Chapter 3: Probability, Distributions, and the Normal Curve in Markets
- Chapter 4: Return Math That Matters
- Chapter 5: Risk-Adjusted Performance
- Chapter 6: Uncertainty: How Wrong Could This Number Be?
- Chapter 7: Regression and Beta
- Chapter 8: Financial Statements as Data
- Chapter 9: Discounted Cash Flow, Honestly
- Chapter 10: Multiples, Implied Growth, and Dividend Models
- Chapter 11: Significance Testing and Event Studies
- Chapter 12: How Many Observations Do You Actually Have?
- Chapter 13: Backtests Without Lying to Yourself
- Chapter 14: Correlation and Real Diversification
- Chapter 15: Position Sizing
John M. Charles, MS, is a researcher and data analyst in Westbrook, Maine. More about the author and the method on the About page.
Companion files
The book’s Before You Begin sends you here for the files. One download holds everything the labs run on: a data folder with the datasets and their build scripts, and a labs folder with one subfolder per chapter, holding the R script, the SPSS syntax where the chapter’s method has an SPSS form, the Excel workbook for Chapters 4, 9, 10, and 15, and the expected output beside each script.
Some datasets arrive as finished files. The rest build once on your own machine from their free sources, using the build scripts in the download, exactly as Before You Begin and Appendix C explain: a source that permits redistribution ships its file with the book, and a source that does not ships its build script instead. Keep the two folders side by side and do not rename them; the lab scripts find the data by its position beside the labs folder.
ZIP archive, about 6.9 MB: the data folder, the labs folder, and the data appendix.
Errata
Errors found after publication are recorded here: what was wrong, what it is now, and which printing or file the correction touches. When a correction touches a companion file, the corrected file replaces the original in the download above.
No corrections have been recorded since publication. When the first one is recorded, it will appear on this page.